Thank you! Your submission has been received

Every market dip triggers the same question: should I get out and wait for the bottom? The research is unambiguous — and the cost of waiting is higher than most people realize.
What does "timing the market" actually mean?
Market timing is the practice of entering and exiting investments based on short-term predictions about where prices are heading.
The goal sounds logical — buy low, sell high. The problem is execution. No one, not even professional fund managers, can do it consistently. The S&P 500 rises roughly 75.6% of all 12-month periods, meaning the odds are stacked against anyone sitting on the sidelines waiting for a "better entry point."
"Time in the market," by contrast, simply means staying invested. It relies on compounding, long-term economic growth, and the mathematical reality that recoveries eventually follow every downturn.
What happens when you miss the market's best days?
This is the most well-documented cost of market timing. Best days and worst days cluster together — often the strongest recoveries happen immediately after the sharpest drops. An investor who seeks to avoid losses frequently misses the rebound entirely.
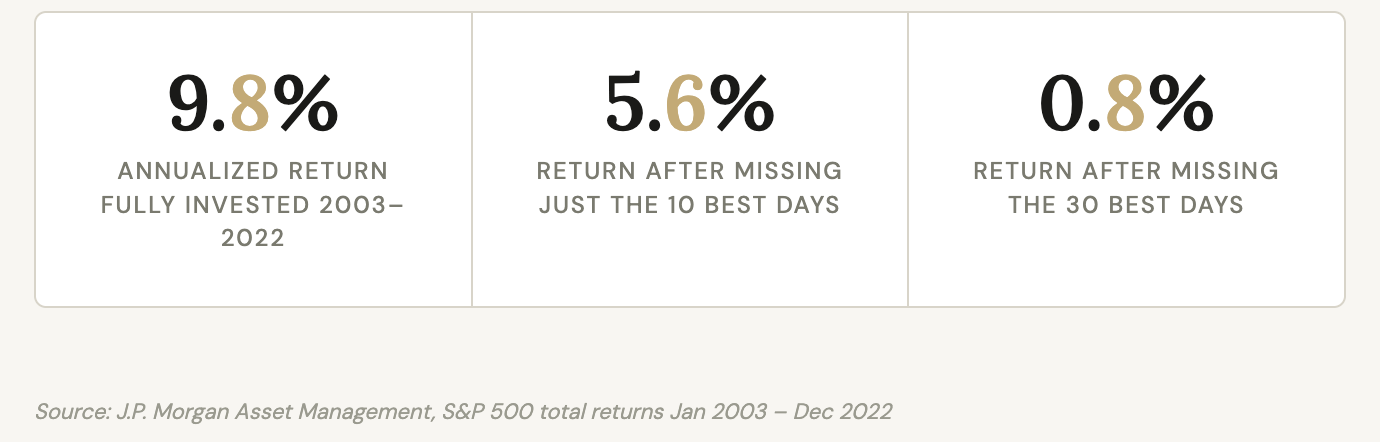
Missing just 10 trading days — out of roughly 5,000 over that 20-year window — cut the annualized return nearly in half. Missing 30 days produced a return that barely kept pace with inflation.
Even bad timing beats staying out
The Schwab Center for Financial Research modeled five investor archetypes over 20 years (2005–2024), each receiving $2,000 annually to invest in an S&P 500-tracking portfolio:
Perfect timing
Approach: invested every year at the market's lowest point
20-Year result: Highest — but impossible to replicate
Invest Immediately
Approach: Invested each year's $2,000 on the first day
20-Year result: $180,456 — a close second
Dollar-Cost Averaging
Approach: Spread investments in equal monthly amounts
$166,591 — nearly identical
Worst Timing
Approach: Invested every year at the market's peak
20-Year result: Still positive — outperformed cash
Stayed in Cash
Approach: Held funds in 30-day Treasury Bills only
20-Year result: Worst outcome by a wide margin
The behavior gap: what investors actually earn
DALBAR's annual study has tracked the 20-year performance of real investor behavior since the 1990s. The gap between what the market delivers and what the average investor actually receives tells the cost of emotional decision-making.
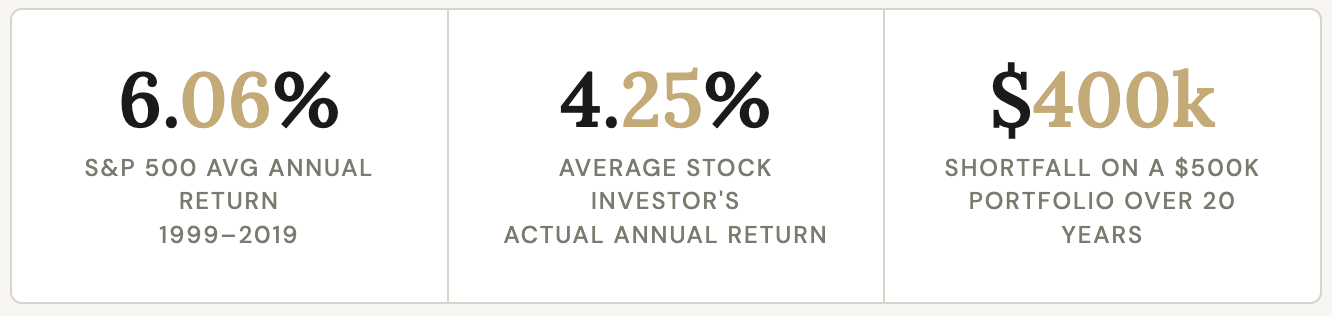
That 1.81% annual gap sounds minor. But on a $500,000 portfolio at age 45, the compounding effect over 20 years produces an account worth $1.1M instead of $1.5M — a $400,000 shortfall, driven almost entirely by behavioral decisions like selling during downturns and buying back after recovery.
Even experts consistently get it wrong
If sophisticated professionals with full-time research teams can't time markets reliably, individual investors face even longer odds. A study from the Center for Retirement Research at Boston College examined target-date fund managers — professionals explicitly hired to manage risk — and found that those who deviated from their investment strategy to "time" the market underperformed their peers. The data across decades shows this is structural, not a matter of skill level.
A 2010 Berkeley study on active day traders in Taiwan found that the average trader lost 0.25% of their portfolio daily, and 93% had quit within five years.
What the research recommends
The convergent finding across Schwab, J.P. Morgan, DALBAR, and independent academic research is consistent:
Invest as early as possible — even imperfect timing outperforms waiting for the "perfect" moment.
Stay invested through volatility — the best recovery days cluster immediately after the worst days.
Use dollar-cost averaging if lump-sum investing feels emotionally difficult — it produces nearly identical long-term results with smoother psychology.
The enemy is inaction — staying in cash over 20 years was consistently the worst-performing strategy in every study reviewed.
The S&P 500 has delivered positive returns across every 20-year rolling period in its history — including periods that included the 2001 dot-com crash, the 2008 financial crisis, and the 2020 pandemic collapse. Time, not timing, is the variable that mattered most.
This article is for educational purposes only and does not constitute financial advice.
Sources: J.P. Morgan Asset Management · Charles Schwab Center for Financial Research · DALBAR Quantitative Analysis of Investor Behavior · Bank of America Merrill Lynch · Mackenzie Investments · Center for Retirement Research, Boston College